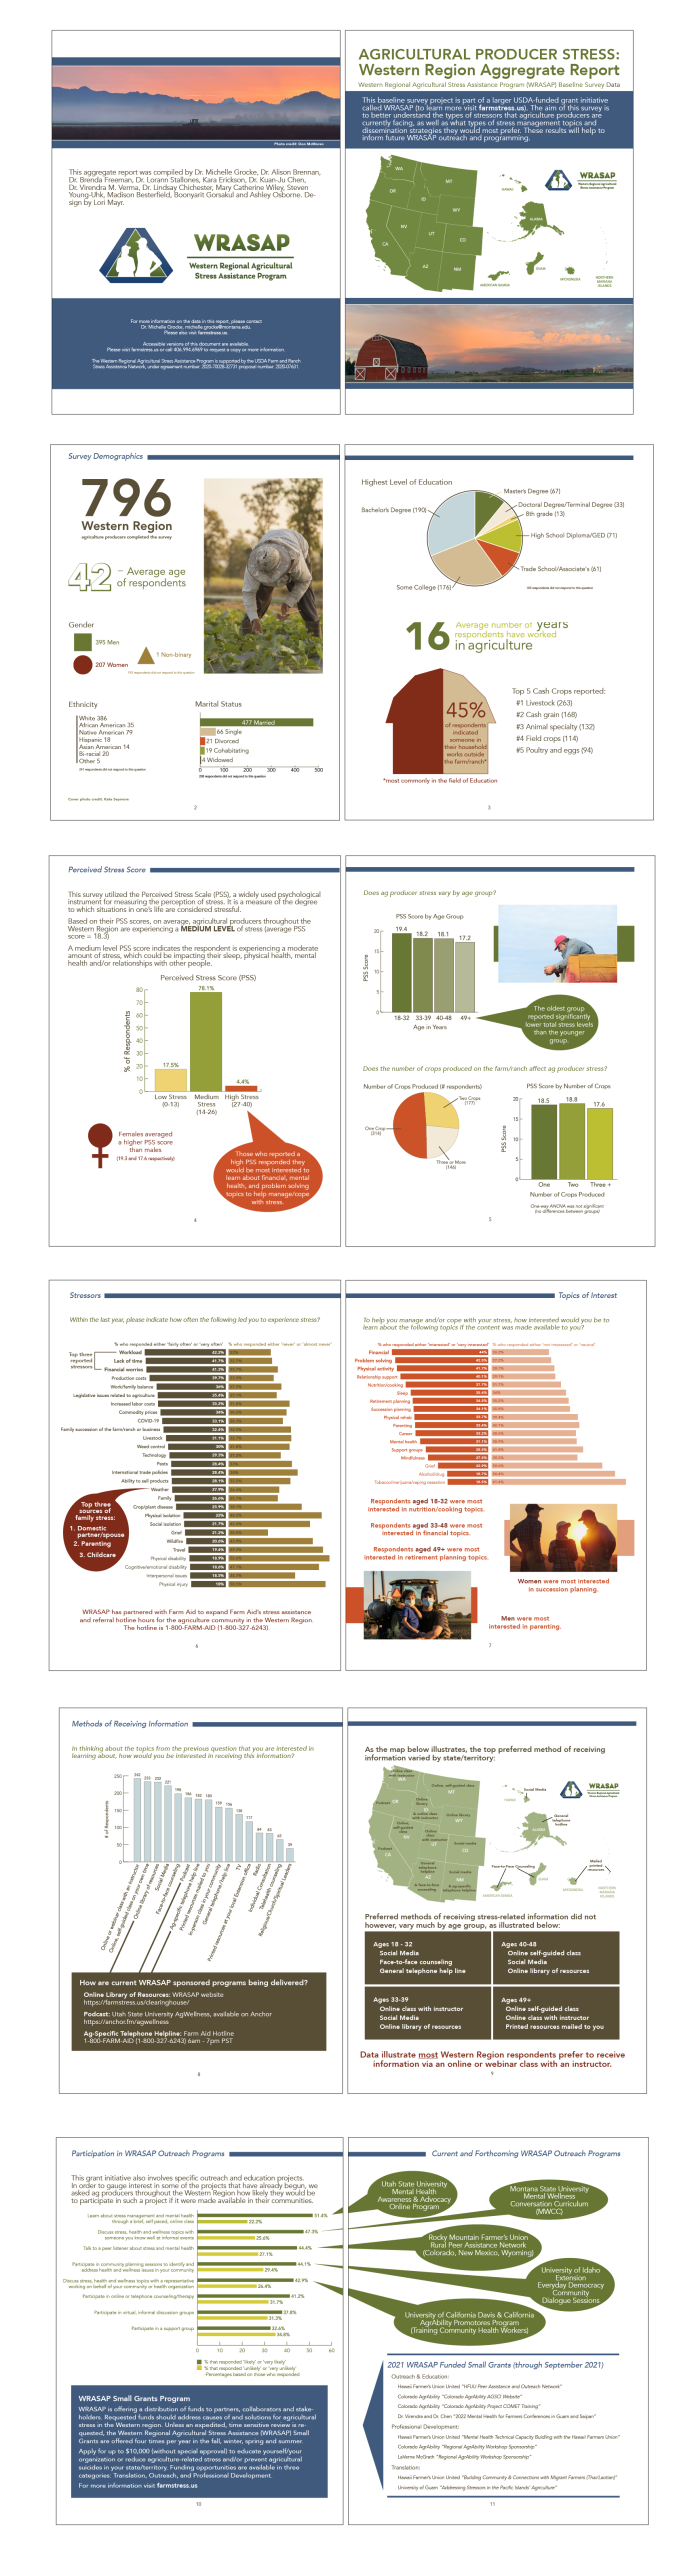
Scientific Publication Graphic Design and Layout and Data Illustrations
This report for the Western Region Stress Assistance Project provided data summaries of their research. Rather than use boring graphs, we created just illustrated graphs using their branding colors. The 12-page report has been distributed to partners and researchers throughout the nation to showcase the work the organization has done for Agricultural Stress.